
A fast website is not simply a website that loads quickly on the developer’s laptop.
Real performance is what happens when a real person opens a real page on a real device, over a real connection, while the browser is downloading HTML, stylesheets, JavaScript, images, fonts, and everything else the page needs.
That is why page speed analysis should begin with evidence rather than guesswork.
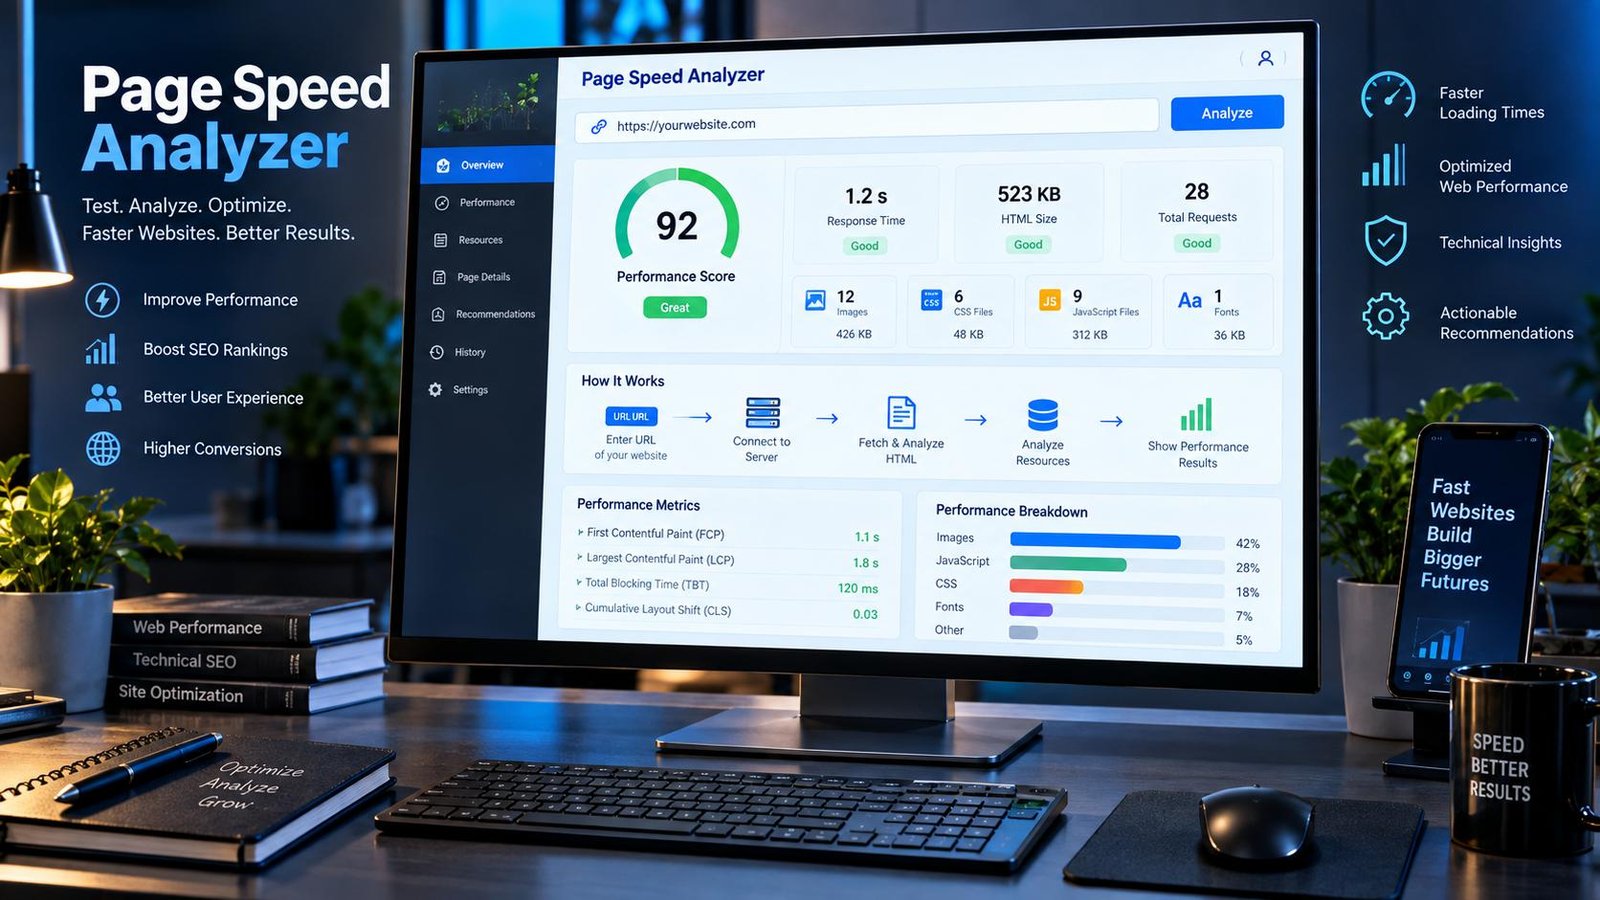
The PKCapra Page Speed Analyzer gives you a quick technical snapshot of a public webpage. Enter a URL and inspect useful page-level signals such as response time, HTML size, resources, images, CSS, JavaScript, HTTPS, viewport configuration, image ALT coverage, content encoding, and other technical details.
It is deliberately straightforward.
You enter a URL.
The page is fetched.
The technical signals are examined.
You get information you can actually use.
This is not about producing a mysterious score and telling you to “make your website faster.” It is about helping you understand what is on the page, what the browser has to deal with, and where a performance investigation should begin.
Page Speed Analyzer
Get a quick technical speed snapshot for any public webpage.
This is a server-side technical snapshot, not a full browser lab test. Real-world Core Web Vitals can vary by device, network, cache, location, and page interaction.
Analysis uses the public URL you provide. Do not submit private, authenticated, or sensitive URLs.
Website Speed Is More Than a Number
Ask five website owners whether their website is fast and you will often get the same answer:
“Yes, it loads quickly for me.”
That answer is understandable.
It is also incomplete.
A website may feel fast on one device and noticeably slower on another. A cached page can feel different from a first visit. A lightweight homepage can perform very differently from a product page containing large images, third-party scripts, tracking tools, video embeds, web fonts, and advertising technology.
Even two pages on the same website can have completely different performance characteristics.
That is why a useful website speed checker should help you inspect the ingredients behind the page rather than reducing everything to one number.
What Does a Page Speed Analyzer Actually Do?
A page speed analyzer examines a webpage and reports technical information that can help you understand its loading characteristics.
The PKCapra tool provides a quick snapshot of the requested public URL, including signals such as:
- Server response time
- HTML document size
- Number of images
- CSS resources
- JavaScript resources
- Render-blocking resource information where detectable
- Image ALT coverage
- Viewport configuration
- HTTPS status
- Content encoding
- Page title and related basic page information
- Other technical signals available from the fetched document
The purpose is not to pretend that one request can explain every aspect of modern web performance.
The purpose is to give you a useful starting point.
Once you know what the page contains and how the server responded, you can decide what deserves deeper investigation.
The First Question: How Long Did the Server Take to Respond?
Before a browser can fully render a webpage, it needs to communicate with the server.
That first conversation matters.
If the server is consistently slow to respond, you can have an excellent-looking page and still create a frustrating experience.
Server response time can be influenced by things such as:
- Hosting quality
- Server workload
- Database queries
- Application code
- Caching
- CDN configuration
- Network conditions
- Backend integrations
- Plugin overhead
- Dynamic content generation
A slow server response does not automatically mean that the hosting company is the problem.
It is a signal that deserves investigation.
Sometimes the answer is better caching.
Sometimes it is inefficient application code.
Sometimes it is a database query.
Sometimes it is simply an overloaded server.
The important thing is to stop guessing.
Measure first.
HTML Size Matters Too
The HTML document is the foundation from which the browser begins understanding the page.
A surprisingly large HTML document can be a sign that a page is carrying more markup than necessary.
This can happen because of:
- Excessive page-builder markup
- Repeated elements
- Embedded data
- Large inline styles
- Inline scripts
- Huge navigation structures
- Excessive widgets
- Plugin-generated markup
- Unnecessary HTML wrappers
That does not mean:
“Large HTML = bad.”
There is no magical HTML-size number that makes a website good or bad.
Context matters.
A complicated application page may naturally contain more markup than a simple article.
The useful question is:
Is the amount of HTML reasonable for what this page is trying to accomplish?
The Page Speed Analyzer helps you see that signal.
Images Are Often Where Performance Starts to Get Interesting
Images can transform a page visually.
They can also transform its loading requirements.
A page containing one properly optimized image is a very different technical object from a page containing twenty-five large photographs.
Images can affect:
- Download size
- Network usage
- Rendering
- Layout stability
- Mobile experience
- Server bandwidth
- Perceived loading speed
But image optimization is not simply a matter of deleting images.
The goal is to deliver the right image at the right size in the right format for the right purpose.
A 2,500-pixel photograph displayed at 400 pixels wide may deserve attention.
A high-resolution image that genuinely needs to be displayed large may be perfectly reasonable.
Again, context beats arbitrary rules.
Image ALT Text Is a Different Problem
There is an important distinction between image performance and image accessibility.
An image can be beautifully compressed and still have poor ALT text.
It can also have excellent ALT text while being unnecessarily large.
These are separate issues.
That is why the PKCapra Page Speed Analyzer can surface image ALT coverage as a technical signal while other PKCapra tools can help you investigate SEO and on-page structure more deeply.
If the page contains images without useful alternative text, investigate them.
If an image is decorative, it may not need descriptive ALT text in the same way a meaningful content image does.
Do not turn ALT text into keyword stuffing.
Write it for the person who needs the alternative representation.
CSS: The Stylesheets Behind the Page
CSS controls how a webpage looks.
But stylesheets also have to be downloaded, parsed, and processed by the browser.
A page with a large collection of stylesheets can carry unnecessary overhead, especially when much of the CSS is not relevant to the page being viewed.
Common sources include:
- Themes
- Page builders
- Plugins
- Design libraries
- Component frameworks
- Third-party widgets
- Legacy styles
- Duplicate stylesheet dependencies
That does not mean every stylesheet should be removed.
Modern websites are often built from many components.
The real question is whether the CSS being loaded is justified by the experience it creates.
A page speed audit helps you identify the size and resource footprint before deciding whether deeper optimization is worthwhile.
JavaScript Can Change the Entire Performance Picture
JavaScript is one of the most powerful technologies on the web.
It is also one of the easiest ways to make a page unnecessarily complicated.
Modern websites use JavaScript for:
- Menus
- Forms
- Search
- Analytics
- Personalization
- Ecommerce
- Animations
- Interactive dashboards
- Chat systems
- A/B testing
- Advertising
- Consent systems
- Third-party integrations
The problem is not JavaScript itself.
The problem is unnecessary JavaScript.
A small business website does not necessarily need the same JavaScript stack as a large web application.
If a page loads scripts from several plugins and third-party services, the browser has more work to do.
That is why simply saying “my website uses JavaScript” tells you almost nothing.
You need to know how much, where it comes from, and what it is actually doing.
What Does Render-Blocking Mean?
Some resources can delay the browser from rendering content that the visitor wants to see.
Stylesheets are a common example.
Certain JavaScript resources can also interfere with the browser’s ability to move quickly through the rendering process.
When a page contains resources that are blocking or delaying rendering, the visitor may see a slower transition from blank screen to usable page.
This is why modern performance optimization often involves questions such as:
- Can a resource load later?
- Can unused code be removed?
- Can CSS be reduced?
- Can JavaScript be deferred where appropriate?
- Can critical resources be prioritized?
- Can third-party scripts be reduced?
The correct solution depends on the website.
There is no responsible “turn everything off” button.
Page Speed and Core Web Vitals Are Related — But They Are Not the Same Thing
This distinction is extremely important.
People often use “page speed,” “performance score,” and “Core Web Vitals” as if they were interchangeable.
They are not.
Google’s current Core Web Vitals focus on loading performance, responsiveness, and visual stability, with LCP, INP, and CLS as the core metrics. Google has also clarified that INP replaced FID as a Core Web Vital.
The PKCapra Page Speed Analyzer is designed as a quick technical snapshot.
It should not be presented as a replacement for Google’s field-data systems or a full Lighthouse/PageSpeed Insights assessment.
That honesty is important.
A URL-level technical snapshot can tell you that a page has many images, significant JavaScript, a certain server response time, or a particular HTML footprint.
But that does not automatically tell you exactly how thousands of real users experience the page.
Those are different measurements answering different questions.
Why One Speed Test Can Never Tell the Whole Story
Suppose you test a page at 10:00 AM.
Then you test it again at 10:05 AM.
Then again at 10:30 AM.
You may see different results.
Why?
Because the web is not a laboratory with one fixed environment.
Performance can change because of:
- Server load
- Cache state
- CDN behavior
- Network conditions
- Third-party services
- Database activity
- Geographic location
- Device capability
- Browser behavior
- Traffic volume
This is why a single test should be treated as a snapshot, not an absolute truth.
The smart approach is to use a quick analyzer to identify potential issues, then use appropriate performance tools and real-user data when deeper investigation is required.
A Fast Page Does Not Automatically Rank #1
This is another SEO myth worth killing.
Improving website performance can improve user experience and can matter to Google’s page experience systems, but there is no honest formula that says:
“Make the page faster and Google will automatically rank it first.”
Search ranking involves many systems and signals.
Content relevance matters.
Content quality matters.
Search intent matters.
Links matter.
Technical accessibility matters.
Indexability matters.
Competition matters.
And many other factors matter.
Speed is important, but speed is not a magic ranking button.
If someone promises guaranteed rankings simply because you improved a page’s loading time, be skeptical.
A better strategy is to make the website genuinely better for users while removing unnecessary technical friction.
What Makes a Website Feel Fast?
This is more interesting than simply asking whether a page is “fast.”
Imagine two pages.
Page A
The page starts showing useful content quickly, the layout remains stable, and the visitor can interact with important controls without waiting.
Page B
The page technically loads in a reasonable amount of time, but the visitor stares at a blank screen, content jumps around, a cookie banner appears late, and the main button becomes usable only after several scripts finish executing.
Which page feels faster?
Usually, Page A.
That is why modern web performance is about experience, not just total download time.
A good performance strategy asks:
What does the visitor see?
When can they use it?
Does the page remain stable while it loads?
What unnecessary work is the browser performing?
The Mobile Question Changes Everything
Desktop performance can hide problems.
A powerful desktop computer on a fast connection can make a heavy webpage feel acceptable.
A mobile device on a slower connection tells a different story.
Mobile visitors may have:
- Less processing power
- Less memory
- Higher network latency
- Limited bandwidth
- Battery constraints
- Smaller screens
- Different browsing conditions
This is one reason responsive design and performance optimization should be considered together.
A page should not merely shrink itself to fit a phone.
It should remain useful and comfortable to use.
The PKCapra analyzer can help identify basic mobile-related technical signals such as viewport configuration, while a dedicated performance platform can provide deeper device-specific measurements.
The Viewport Meta Tag Still Matters
A mobile-friendly page needs to tell the browser how the viewport should behave.
The viewport configuration is a small technical detail, but it can have a large impact on mobile presentation.
A missing or incorrect viewport configuration can cause a page designed for desktop dimensions to behave poorly on smaller screens.
This is one of those checks that takes very little effort but can prevent an unnecessary mobile problem.
Third-Party Scripts Deserve Suspicion, Not Blind Removal
Third-party scripts are everywhere.
Analytics.
Chat.
Advertising.
Social widgets.
Heatmaps.
Conversion tracking.
Cookie management.
Payment services.
Embedded content.
Marketing platforms.
Many of them provide genuine value.
The problem appears when a website accumulates them without reviewing their cost.
A script that contributes almost nothing to the visitor experience but adds network requests, JavaScript execution, or rendering work deserves a second look.
Ask:
Do we need this?
Is it used on every page?
Can it load later?
Can it be replaced with something lighter?
Does the business value justify the performance cost?
That is a much more intelligent performance conversation than simply declaring all third-party scripts bad.
WordPress Websites Have a Special Performance Challenge
WordPress makes publishing easy.
That is one of its greatest strengths.
It also means a website can accumulate technical baggage over time.
A typical WordPress website may have:
- A theme
- A page builder
- SEO plugins
- Security plugins
- Cache plugins
- Form plugins
- Analytics integrations
- Ecommerce plugins
- Social integrations
- Image optimization tools
- Custom code
Every additional system can potentially add resources or processing.
That does not mean you should uninstall plugins randomly.
It means you should understand what your website is actually loading.
A good performance audit is often less about adding another optimization plugin and more about removing unnecessary complexity.
Do Not Optimize Blindly
One of the worst ways to improve website speed is to make ten changes simultaneously.
Install a cache plugin.
Change the CDN.
Minify everything.
Delay JavaScript.
Replace the image format.
Remove three plugins.
Change the theme.
Then test the website.
What changed?
Nobody knows.
A better process is controlled.
Step 1: Measure
Establish what the page is doing now.
Step 2: Identify
Find the largest or most obvious sources of unnecessary work.
Step 3: Change
Make one meaningful improvement.
Step 4: Test
Check whether the change actually helped.
Step 5: Repeat
Continue only where the evidence supports another change.
This approach is slower than clicking every optimization setting in a plugin.
It is also much less likely to break the website.
What Should You Check First?
If you are looking at a page for the first time, start with the basics.
Server response
Is the server responding quickly enough to deserve further investigation?
HTML
Is the document unexpectedly large?
Images
Are there unusually many images or unnecessarily heavy visual assets?
CSS
Is the page loading a large collection of stylesheets?
JavaScript
Are there more scripts than the page actually needs?
Render-blocking resources
Are important resources delaying the initial experience?
Mobile viewport
Does the page have appropriate viewport configuration?
HTTPS
Is the page being served securely?
Content encoding
Is the server delivering compressed content appropriately?
These checks do not solve every performance problem.
They help you find the doors worth opening next.
A Page Can Be Technically Heavy and Still Be Worth It
Performance optimization should never become an obsession with making every page as small as possible.
Consider an online store.
Product photography is part of the product experience.
An online publication may legitimately use several images.
A web application may require JavaScript to function.
A design portfolio may need visual assets to communicate the work.
A booking system needs interactive functionality.
The objective is not:
“Remove everything.”
The objective is:
“Remove what does not earn its place.”
That is a much better performance philosophy.
The Difference Between Optimization and Sacrifice
Imagine removing an important product image just to save bandwidth.
The page gets smaller.
But customers can no longer see the product properly.
Was that an optimization?
Technically, perhaps.
Business-wise, probably not.
The same applies to removing useful functionality, delaying important interaction, or making content harder to access simply because a benchmark says the page should be smaller.
Good performance work protects the experience while removing waste.
Page Speed and SEO Should Work Together
SEO and performance are often treated as separate departments.
They should not be.
A search engine needs to discover and crawl your URLs.
Users need to access them.
The page needs to communicate its topic clearly.
The website needs good internal linking.
The content needs to satisfy the searcher’s intent.
The page should work across devices.
And the technical implementation should not create unnecessary friction.
That is why page speed fits naturally into a larger technical SEO workflow.
For example, after checking performance, you might inspect the page’s metadata with the Meta Tags Analyzer, review its title with the Title Tag Analyzer, examine headings with the SEO Heading Analyzer, and check crawlability with the Indexability & Crawlability Analyzer.
Performance is one piece of the system.
A Practical Technical SEO Performance Workflow
Here is a workflow that makes sense for most websites.
1. Start with important pages
Do not begin by testing random URLs.
Start with:
- Homepage
- Main service pages
- Important product pages
- High-traffic articles
- Landing pages
- Pages receiving search traffic
- Conversion-focused pages
These pages have a reason to exist.
They deserve attention first.
2. Run a quick technical snapshot
Use the Page Speed Analyzer to understand the page’s basic resource and response characteristics.
3. Look for obvious problems
Large HTML.
Heavy images.
Large numbers of scripts.
Unexpected CSS.
Missing viewport configuration.
Slow response.
4. Investigate the cause
Do not immediately install another plugin.
Find out why the problem exists.
5. Make one change
Keep the test controlled.
6. Recheck
Confirm whether the change produced an improvement.
7. Move to deeper performance measurement
When you need Core Web Vitals, lab diagnostics, or field data, use the appropriate specialized tools.
This layered approach is far more useful than chasing one universal score.
What Are Core Web Vitals?
Core Web Vitals are Google’s set of user-focused metrics for assessing important aspects of page experience.
The current Core Web Vitals are:
Largest Contentful Paint — LCP
LCP relates to loading performance and measures when the largest content element becomes visible within the viewport.
Interaction to Next Paint — INP
INP focuses on responsiveness and how quickly the page responds to user interactions.
Cumulative Layout Shift — CLS
CLS measures visual stability and captures unexpected movement of page content.
These metrics answer questions that a simple HTML/resource analyzer cannot fully answer.
Google’s documentation and updates identify INP as the current replacement for FID in Core Web Vitals.
For deeper understanding of web performance and Core Web Vitals, the official web.dev performance documentation is an excellent technical reference.
Why Layout Stability Matters
Imagine clicking a button just as the page suddenly moves.
Or trying to read a paragraph while an advertisement pushes the content downward.
Or tapping a menu item and accidentally hitting something else because an image suddenly appears above it.
The page may not be “slow” in the traditional sense.
But it feels unreliable.
That is the problem visual stability tries to capture.
Large images without reserved dimensions, dynamically inserted content, late-loading fonts, advertisements, and other layout changes can contribute to a poor experience.
Performance is therefore not only about speed.
It is also about predictability.
Why Interaction Speed Matters
A page can appear visually loaded and still feel slow.
You tap a button.
Nothing seems to happen.
You tap again.
Still nothing.
Then the page suddenly responds.
This is where responsiveness becomes important.
Heavy JavaScript can create this type of experience because the browser has work to perform before it can respond smoothly.
Again, this is why simply reducing image size is not always the answer.
Sometimes the largest performance improvement comes from reducing JavaScript work.
Why Loading Speed Still Matters
The first impression of a webpage happens before the visitor reads a single sentence.
If the page remains blank or visually incomplete for too long, people may leave.
If important content appears quickly, the visitor can begin consuming it while secondary resources continue loading.
Good performance therefore supports the basic purpose of a webpage:
Give people useful information without making them wait unnecessarily.
Does a Better Page Speed Score Guarantee Better Rankings?
No.
And it is important that a serious SEO tool tells you that.
Performance is one part of website quality and page experience.
It is not a guaranteed ranking formula.
Google’s documentation covers page experience as part of the wider Search ecosystem rather than presenting one performance score as a direct ranking guarantee. Google’s Search documentation also emphasizes that search appearance depends on many factors and systems.
So do not optimize a page merely because a number looks bad.
Optimize it because:
- users deserve a better experience
- mobile visitors deserve a usable page
- important content should become available efficiently
- unnecessary technical work should be removed
- your website should be easier to maintain
- performance problems can affect real business outcomes
That is a much stronger reason.
Page Speed During a Website Migration
Website migrations can create performance problems that did not exist before.
A new hosting environment may behave differently.
A new theme may load more resources.
A new page builder may generate more markup.
A new CDN configuration may change caching behavior.
A redesigned site may introduce large hero images.
A migration is therefore not complete simply because every URL redirects correctly.
You also need to verify that the new pages perform appropriately.
Google recommends thoroughly testing a new site during migrations and monitoring the effects after launch.
This is another situation where the Page Speed Analyzer becomes useful as a quick before-and-after diagnostic.
Test the Same Page Before and After a Change
This is one of the simplest performance habits you can develop.
Before:
URL → baseline
Make the change.
After:
Same URL → new result
Do not compare unrelated pages.
Do not compare a homepage with a product page.
Do not compare a cached result from one environment with an uncached result from another and pretend the numbers are directly equivalent.
Keep the test as consistent as possible.
That gives you a much better idea of whether the change actually helped.
What a Page Speed Analyzer Cannot Tell You
Being honest about limitations makes a tool more useful.
A quick URL analyzer cannot reproduce every condition experienced by every visitor.
It cannot know exactly how your page behaves on every device, browser, network, geographic region, or interaction pattern.
It should not be treated as a replacement for:
- Real-user monitoring
- Full Lighthouse diagnostics
- Chrome UX Report data
- Detailed Core Web Vitals analysis
- Browser performance profiling
- Server monitoring
- Application performance monitoring
- Database profiling
Instead, use it as an efficient first diagnostic layer.
That is often exactly what you need when investigating a URL.
When Should You Use the Page Speed Analyzer?
Use it when:
- You publish a new page
- You redesign a website
- You change your WordPress theme
- You install several plugins
- You add a page builder
- You add third-party scripts
- You upload large images
- You change hosting
- You configure a CDN
- You change caching
- You migrate a website
- You notice slower loading
- A client asks whether a page is technically heavy
- You are performing a technical SEO audit
- You want a quick before-and-after comparison
It is especially useful when you do not yet know where the problem is.
A Better Question Than “How Fast Is My Website?”
Instead of asking:
“What is my website speed score?”
ask:
“What is making this page expensive for the browser?”
That question leads to better decisions.
Maybe the answer is a huge hero image.
Maybe it is twenty unnecessary scripts.
Maybe the server is slow.
Maybe the HTML is bloated.
Maybe the page is loading a collection of resources from plugins that are not actually needed.
Maybe there is no obvious issue at all, and the next step should be a proper Core Web Vitals investigation.
The analyzer helps you move from a vague complaint to a more specific question.
Page Speed Optimization Is a Process, Not a Plugin
There is no universal “make website fast” plugin.
Caching can help.
Image optimization can help.
A CDN can help.
Code optimization can help.
Better hosting can help.
Reducing third-party scripts can help.
But every website is different.
A technique that produces a dramatic improvement on one site may produce almost no improvement on another.
Worse, aggressive optimization can break functionality.
That is why performance optimization should be treated as an engineering process:
Measure → Understand → Change → Test → Repeat.
Not:
Install plugin → click every checkbox → hope.
The Most Common Page Speed Mistakes
Loading images much larger than necessary
An image displayed at a small size does not necessarily need to be downloaded at enormous resolution.
Keeping plugins that no longer serve a purpose
Unused functionality can still contribute to website complexity.
Loading every script everywhere
A contact form does not necessarily need its JavaScript on every page.
Ignoring third-party services
External scripts can become a significant part of a page’s resource footprint.
Treating minification as the entire solution
Minification can reduce file size, but it cannot fix fundamentally unnecessary resources.
Optimizing only desktop
A website that feels excellent on a powerful desktop can feel very different on mobile.
Chasing a perfect score
A benchmark is useful only when it helps you improve the actual experience.
Making too many changes at once
Without controlled testing, you cannot tell what actually worked.
What Should You Do If the Page Is Slow?
Do not panic.
Do not immediately change your entire website.
Start with the evidence.
Run the page through the analyzer.
Look at the response time.
Look at the HTML.
Look at the resource footprint.
Look at images.
Look at CSS.
Look at JavaScript.
Look for obvious problems.
Then choose the largest problem that is practical to fix.
If the server is slow, investigate the backend.
If images dominate the page, optimize the image pipeline.
If JavaScript is excessive, identify which scripts are actually needed.
If third-party services dominate, review their business value.
If the page looks fine technically but real users still experience poor responsiveness, move to a proper Core Web Vitals and real-user-data investigation.
Page Speed and Internal Linking
Performance does not exist separately from site architecture.
A page may load beautifully but still be difficult for users and crawlers to discover.
That is why performance analysis should sit alongside internal-link analysis.
The Internal Links / Crawl Path Analyzer can help you investigate how pages connect to one another.
The XML Sitemap Analyzer can help you examine sitemap URLs.
The Indexability / Crawlability Analyzer can help you investigate whether important pages can be properly crawled and indexed.
These checks answer different questions.
Together, they create a more complete picture.
Page Speed and Metadata
A fast page with poor metadata is still a poorly optimized page.
Performance does not replace basic SEO.
After checking speed, review the page’s title using the Title Tag Analyzer.
Then examine the description with the Meta Description Analyzer.
Use the SEO Heading Analyzer to review heading structure.
Use the Meta Tags Analyzer when you want a broader metadata inspection.
The objective is not to optimize one signal while ignoring the others.
The objective is to build a page where technical performance, accessibility, content, structure, and search intent all work together.
Page Speed and Broken Resources
A page can be slow because it is doing too much.
It can also behave badly because some of the resources it needs are failing.
A stylesheet might fail.
An image might return an error.
A JavaScript file might be unavailable.
A third-party resource might time out.
That is where the Broken Link Checker can complement a performance investigation.
And if a resource or page is redirecting unexpectedly, the Redirect Checker can help you understand what is happening.
Performance problems and technical URL problems often overlap.
A Real-World Example
Imagine an ecommerce product page.
It contains:
- 12 product images
- 4 promotional banners
- 8 JavaScript files
- 6 CSS files
- Analytics
- Chat
- Reviews
- Social widgets
- A large page-builder layout
The page is technically functional.
Nothing is “broken.”
But the browser has a lot of work to do.
The right question is not:
“Which single plugin makes the page slow?”
The better question is:
“Which resources contribute meaningful value, and which are unnecessary?”
Maybe three scripts can be removed.
Maybe the banners can be compressed.
Maybe product images can be delivered at appropriate dimensions.
Maybe the chat widget can load later.
Maybe the page-builder markup can be simplified.
Small improvements can compound.
Performance Optimization Should Protect the Business
This is the part many technical articles forget.
Website performance is not an abstract competition.
A business website exists for a reason.
It may sell something.
Generate leads.
Publish information.
Collect registrations.
Book appointments.
Display a portfolio.
Build trust.
If an optimization makes the page technically lighter but damages the conversion experience, it may not be a good optimization.
The best performance work asks two questions simultaneously:
How can we make this page more efficient?
and
How can we do that without damaging what the page is supposed to accomplish?
That is the balance worth aiming for.
Frequently Asked Questions
What is a Page Speed Analyzer?
A Page Speed Analyzer is a tool that examines a public webpage and reports technical signals related to loading and resource usage. PKCapra provides a quick page-level snapshot including response time, HTML, images, CSS, JavaScript, and other detectable technical signals.
Is the PKCapra Page Speed Analyzer the same as Google PageSpeed Insights?
No. They serve different purposes. PKCapra provides a quick technical snapshot of a public URL. Google’s PageSpeed Insights and related performance systems provide deeper performance diagnostics and can incorporate additional performance data.
Does the Page Speed Analyzer measure Core Web Vitals?
The PKCapra tool should not be treated as a complete Core Web Vitals measurement system. Core Web Vitals require appropriate performance measurement methods and, depending on the metric and tool, can involve real-user or lab data.
What are the current Core Web Vitals?
The current Core Web Vitals are LCP, INP, and CLS. INP replaced FID as a Core Web Vital.
Is a 200 status code enough to prove a page is fast?
No. HTTP status and performance are different things. A page can return 200 OK while still being expensive to load or slow to become interactive.
Does website speed affect SEO?
Performance can contribute to the overall page experience and technical quality of a website, but there is no simple rule that says a faster page automatically outranks a slower page.
How can I make my website faster?
Start by measuring the page, identifying unnecessary work, optimizing images and resources, reviewing JavaScript and third-party services, improving caching where appropriate, and addressing server-side bottlenecks.
Should I remove JavaScript to make my website faster?
Not automatically. JavaScript can provide important functionality. Remove or delay unnecessary work rather than removing useful functionality blindly.
Should I optimize every image on my website?
You should review important images and make sure they are appropriately sized and efficiently delivered. Do not sacrifice meaningful visual content simply to reduce a number.
Is a perfect speed score necessary?
No. A perfect laboratory score is not the purpose of a website. The goal is a fast, stable, useful experience for real visitors.
Why is my website fast for me but slow for other people?
Your browser may have cached resources, your connection may be faster, your device may be more powerful, or your location may be closer to the server or CDN. Real-user performance can differ significantly between environments.
How often should I check page speed?
Check important pages after major changes such as redesigns, migrations, hosting changes, theme changes, plugin changes, CDN configuration changes, and significant content or image updates. For important websites, ongoing performance monitoring is even better.
Can a CDN make my website faster?
A CDN can reduce latency and improve the delivery of static resources for visitors in different geographic locations, but it does not automatically fix every performance problem.
Does caching always make a website faster?
Caching can significantly reduce repeated server work and improve response times, but caching configuration varies by website. Incorrect caching can also cause stale content or functionality problems.
Why is my WordPress website slow?
There can be many causes, including hosting, database work, themes, plugins, page builders, images, JavaScript, third-party services, caching, and inefficient code. The correct solution depends on the evidence.
The Page Speed Checklist I Would Actually Use
If I were auditing a website manually, I would not begin by chasing a score.
I would ask:
Server
- Is the server responding efficiently?
- Is hosting capacity adequate?
- Is caching configured properly?
HTML
- Is the document unnecessarily large?
- Is there excessive page-builder markup?
- Is important content being delivered efficiently?
Images
- Are images appropriately sized?
- Are large images being loaded unnecessarily?
- Are important images missing useful ALT text?
CSS
- Are unnecessary stylesheets being loaded?
- Is the page dependent on excessive CSS?
JavaScript
- How much JavaScript is loaded?
- Which scripts are actually necessary?
- Are third-party scripts justified?
Mobile
- Is the viewport configured correctly?
- Does the layout remain usable on small screens?
Experience
- Does important content appear quickly?
- Can users interact quickly?
- Does the layout remain stable?
SEO
- Can search engines crawl the page?
- Is the page indexable?
- Is the canonical correct?
- Are title and description useful?
- Is the internal linking sensible?
That is a much more valuable audit than saying:
“Your score is 78. Good luck.”
Use the Number as a Clue, Not a Verdict
A page speed tool should make you curious.
It should not make you afraid.
If the analyzer finds a large HTML document, investigate it.
If it finds many scripts, identify them.
If response time is high, investigate the server.
If images dominate the page, review their delivery.
If the page appears technically reasonable but users still report poor performance, use deeper performance measurement.
The result is not the end of the investigation.
It is the beginning.
A Faster Website Is Really a Better Website
The ultimate goal is not to impress another SEO professional with a green circle.
The goal is to make the website feel better.
A visitor should not have to think about your server.
They should not care how many plugins are installed.
They should not wonder why an image is taking forever.
They should not wait for five marketing scripts before a button responds.
They should simply arrive, understand the page, interact with it, and get what they came for.
That is what performance optimization is really about.
Less waiting. Less unnecessary work. More useful experience.
Start With One URL
You do not need to audit your entire website before doing anything.
Start with one important page.
Run it through the Page Speed Analyzer.
Look at what the page is actually loading.
Find the obvious sources of unnecessary weight.
Fix one thing.
Test again.
Then move to the next important page.
If you are doing a wider technical SEO audit, combine the findings with the HTTP Status Checker, Redirect Checker, Broken Link Checker, Canonical URL Checker, Indexability & Crawlability Analyzer, XML Sitemap Analyzer, and the on-page SEO tools.
That is how a collection of individual checks becomes a proper website audit.
And that is the real purpose of a page speed analyzer:
not to give you another number to stare at, but to help you understand what your webpage is doing—and what you can do about it.