
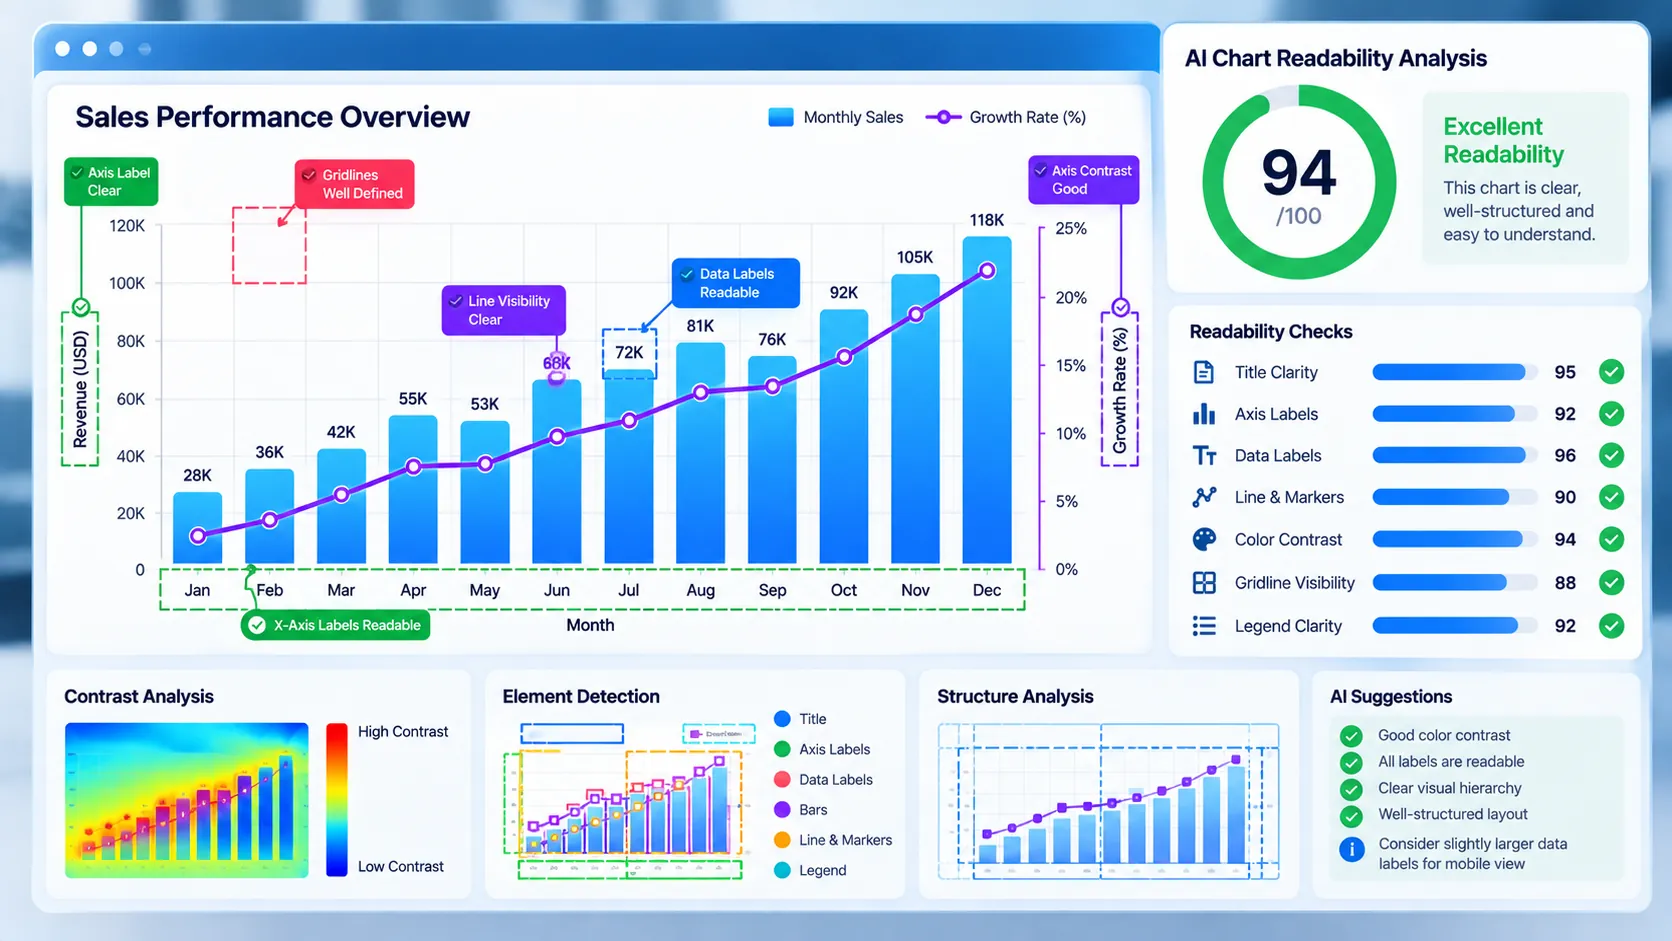
The Chart Image AI Readability Checker evaluates whether a chart image has measurable visual conditions that support clear AI-oriented extraction of labels, values, plotted marks, lines, legends, and chart structure. It runs the analysis locally in your browser and produces a 0–100 readability baseline without requiring an API key or account.
Chart Image AI Readability Checker
Check whether a chart image has measurable visual conditions that support clear AI-oriented extraction of labels, values, marks, lines, legends and chart structure.
Upload a chart to check readability
AI-oriented chart readability assessment
—
Chart readability checks
How to Use the Chart Image AI Readability Checker in Simple Steps
- Upload a chart image. Drag and drop a JPG, PNG, WebP, GIF, BMP, or AVIF image into the tool, or choose it from your device. The maximum file size is 20 MB.
- Click “Check Chart Readability.” The browser creates a scaled analysis representation and evaluates visual signals such as fine detail, structural transitions, mark or line visibility, contrast, layout balance, clutter, and image scale.
- Review the result. The report shows a 0–100 readability score, summary status, image dimensions, format, file size, megapixels, aspect ratio, and individual chart-readability checks.
- Save or share the analysis. Use Copy Report, Copy JSON, Download JSON, or Download PDF. Load Example creates a sample chart for testing, while Clear resets the tool for another image.
Technical Breakdown of the Chart Image AI Readability Checker
The Chart Image AI Readability Checker is a browser-side heuristic preflight tool. It measures observable image characteristics that can affect chart readability and extraction, but it does not use an external AI vision model.
Label and detail signal
Chart labels, axis text, legends, annotations, tick values, and small data details require sufficient image detail to remain distinguishable. The checker evaluates fine-detail and local visual-transition signals to estimate whether the image retains useful information at that scale.
A weak result can occur when a chart has been exported too small, aggressively compressed, blurred, or repeatedly resized.
Chart structure signal
Charts normally contain organized visual transitions created by axes, gridlines, plot regions, labels, shapes, and other structural elements. The checker evaluates directional and spatial image variation to estimate whether useful chart-like structure is visually present.
This is an image-level signal. The tool does not determine whether an image is specifically a bar chart, line chart, pie chart, scatter plot, or another chart type.
Mark and line signal
Data marks and lines can carry much of the information in a chart. The checker evaluates visual activity and neighboring-pixel transitions to estimate whether plotted marks or line-based structures have enough visible separation.
The result does not mean that individual bars, points, lines, or slices have been semantically identified.
Text and visual contrast
Chart text and data marks need sufficient separation from their backgrounds. Local luminance transitions help estimate whether important visual elements have measurable contrast.
Low-contrast labels, pale gridlines, thin lines, similar-colored marks, and busy backgrounds can reduce this signal.
Layout balance
Charts often rely on a clear relationship between the plot area, labels, axes, legend, and surrounding whitespace. The analyzer samples visual activity across the image to estimate how information is distributed across the available canvas.
A balanced result does not mean that the chart follows a particular design standard. It only describes measurable image-level distribution.
Clutter control
Dense charts can contain many legitimate labels, data marks, gridlines, legends, and annotations. The checker evaluates visual activity and complexity to identify conditions where excessive visual competition may make extraction more difficult.
A high-detail chart is not automatically a poor chart. Interpret the clutter signal together with label detail, structure, mark visibility, and scale.
Image scale
Source dimensions influence how much pixel information is available for small chart labels and marks. The checker records the original dimensions and uses a scaled working canvas for efficient browser-side analysis.
The analysis representation is capped at approximately 1,800 pixels on the longest side. This keeps processing practical while retaining a useful visual representation of the source.
Score interpretation
The checker combines its visual checks into a 0–100 chart readability baseline:
- 80–100: Strong chart readability baseline
- 60–79: Moderate chart readability baseline
- 0–59: Limited chart readability baseline
The score is a visual preflight signal rather than an AI-model compatibility guarantee. Different AI vision systems may interpret the same chart differently.
What the checker does not verify
The tool does not read the actual chart labels or values, identify semantic chart objects, verify whether plotted values are mathematically correct, determine whether a legend matches the correct series, or prove that a particular AI model will understand the chart.
For broader image-level AI extraction checks, use the AI Vision Extractability Checker. For general image preparation signals, use the AI Image Readiness Checker. For screenshots containing charts or interface elements, the Screenshot AI Extractability Checker can provide a screenshot-focused baseline.
Browser-side processing and privacy
The core image analysis runs in the browser. The tool does not require an external AI vision API, API key, or account for its readability analysis.
The browser decodes the selected image and performs the visual sampling locally. The generated report contains measurements and analysis information rather than requiring server-side image processing.
Supported formats and file limit
The tool accepts JPG, PNG, WebP, GIF, BMP, and AVIF images when the browser can decode the selected format. The maximum file size is 20 MB.
Browser support can vary for uncommon image encodings, even when the file extension indicates a supported format.
Developer Snippets (Automate This Tool Offline)
The following snippets provide basic offline chart-image preflight checks. They can help identify dimensions, file size, and basic image properties before using the full browser-based analyzer. They do not reproduce the PKCapra readability score or its visual heuristic calculations.
Python
from PIL import Image
from pathlib import Path

image_path = Path("chart.png")

with Image.open(image_path) as image:
    width, height = image.size
    megapixels = (width * height) / 1_000_000
    aspect_ratio = width / height

    print(f"Format: {image.format}")
    print(f"Dimensions: {width} x {height}")
    print(f"Megapixels: {megapixels:.2f}")
    print(f"Aspect ratio: {aspect_ratio:.3f}")

    if width < 1200 or height < 800:
        print("Review: small dimensions may limit chart label and mark detail.")
    else:
        print("Review: dimensions provide a larger working area for chart detail.")
PowerShell
Add-Type -AssemblyName System.Drawing

$path = ".\chart.png"
$file = Get-Item $path
$image = [System.Drawing.Image]::FromFile($file.FullName)

$width = $image.Width
$height = $image.Height
$megapixels = ($width * $height) / 1000000
$aspectRatio = $width / $height

Write-Output "Format: $($image.RawFormat)"
Write-Output "Dimensions: $width x $height"
Write-Output ("Megapixels: {0:N2}" -f $megapixels)
Write-Output ("Aspect ratio: {0:N3}" -f $aspectRatio)
Write-Output ("File size: {0:N2} MB" -f ($file.Length / 1MB))

if ($file.Length -gt 20MB) {
    Write-Output "Review: file is above the 20 MB web-tool limit."
}

$image.Dispose()
Node.js
const fs = require("fs");

const filePath = "./chart.png";
const stats = fs.statSync(filePath);

const sizeMB = stats.size / (1024 * 1024);

console.log(`File size: ${sizeMB.toFixed(2)} MB`);

if (sizeMB > 20) {
    console.log("Review: the image exceeds the 20 MB web-tool limit.");
} else {
    console.log("Review: file size is within the web-tool limit.");
}
These offline checks are useful for asset preparation, while the PKCapra tool adds browser-side visual analysis for chart detail, structure, marks or lines, contrast, layout, clutter, and scale.
Native Software Workaround: Improve a Chart Before AI Extraction
Excel and PowerPoint provide practical controls for improving a chart before exporting it as an image.
- Open the chart in Excel or PowerPoint and enlarge the chart area so labels and plotted marks have more available space.
- Select the chart and use Chart Design → Add Chart Element to review titles, axis titles, data labels, legends, and gridlines.
- Increase small label sizes through Home → Font Size or the chart text formatting controls.
- Select chart elements and use Format → Shape Fill, Shape Outline, or font color controls to improve visual separation.
- Remove decorative elements that do not communicate data.
- Reduce unnecessary gridlines or visual effects when they compete with plotted marks.
- Keep legends, axis labels, and important annotations inside the exported composition rather than placing essential information outside the chart.
- Avoid excessive compression when exporting the chart as an image.
- Export through File → Save As or File → Export and choose a suitable raster format such as PNG.
- Upload the exported image to the Chart Image AI Readability Checker and review the label/detail, structure, mark/line, contrast, layout, clutter, and scale signals.
For diagrams rather than statistical charts, use the Image Diagram AI Readability Checker.
Frequently Asked Questions
What does the Chart Image AI Readability Checker measure?
The Chart Image AI Readability Checker measures label/detail visibility, chart-like structure, mark or line visibility, contrast-related signals, layout balance, visual clutter, and image scale.
Does the tool use an AI vision model?
The tool does not use an external AI vision model for its core analysis. It uses browser-side image sampling and heuristic visual measurements.
Can the tool read chart labels and values?
Chart label and value reading is not performed by the checker. The tool measures visual conditions that can affect the visibility and extraction of those elements.
Can the checker identify whether an image is a bar chart or line chart?
Chart-type identification is not part of the checker. The analysis evaluates visual structure, marks, lines, detail, contrast, clutter, and scale without assigning semantic chart objects.
Does a high score mean an AI will correctly understand the chart?
A high score does not guarantee correct AI interpretation. It indicates stronger measurable visual conditions according to this checker, while individual AI vision systems can use different processing methods and produce different results.
What image formats are supported?
JPG, PNG, WebP, GIF, BMP, and AVIF are supported when the browser can decode the image.
What is the maximum file size?
The maximum supported upload size is 20 MB.
Why can a chart with correct data receive a limited readability score?
Chart data correctness and image readability are different properties. A correct chart can still have small labels, weak contrast, excessive visual density, low image dimensions, or faint plotted marks that reduce measurable readability signals.
How can I improve a low chart-readability result?
Increasing chart dimensions, enlarging small labels, improving text and mark contrast, reducing unnecessary visual clutter, preserving important lines or marks, and exporting at an appropriate image resolution can improve the underlying visual conditions.
Can I save the analysis?
The tool provides Copy Report, Copy JSON, Download JSON, and Download PDF options. The report contains the measured image properties, score, checks, findings, and methodology note.
Is the uploaded chart sent to a remote AI service?
The core chart-readability analysis is performed locally in the browser and does not require a remote AI vision API. The tool is designed around browser-side visual analysis rather than server-side image processing.