
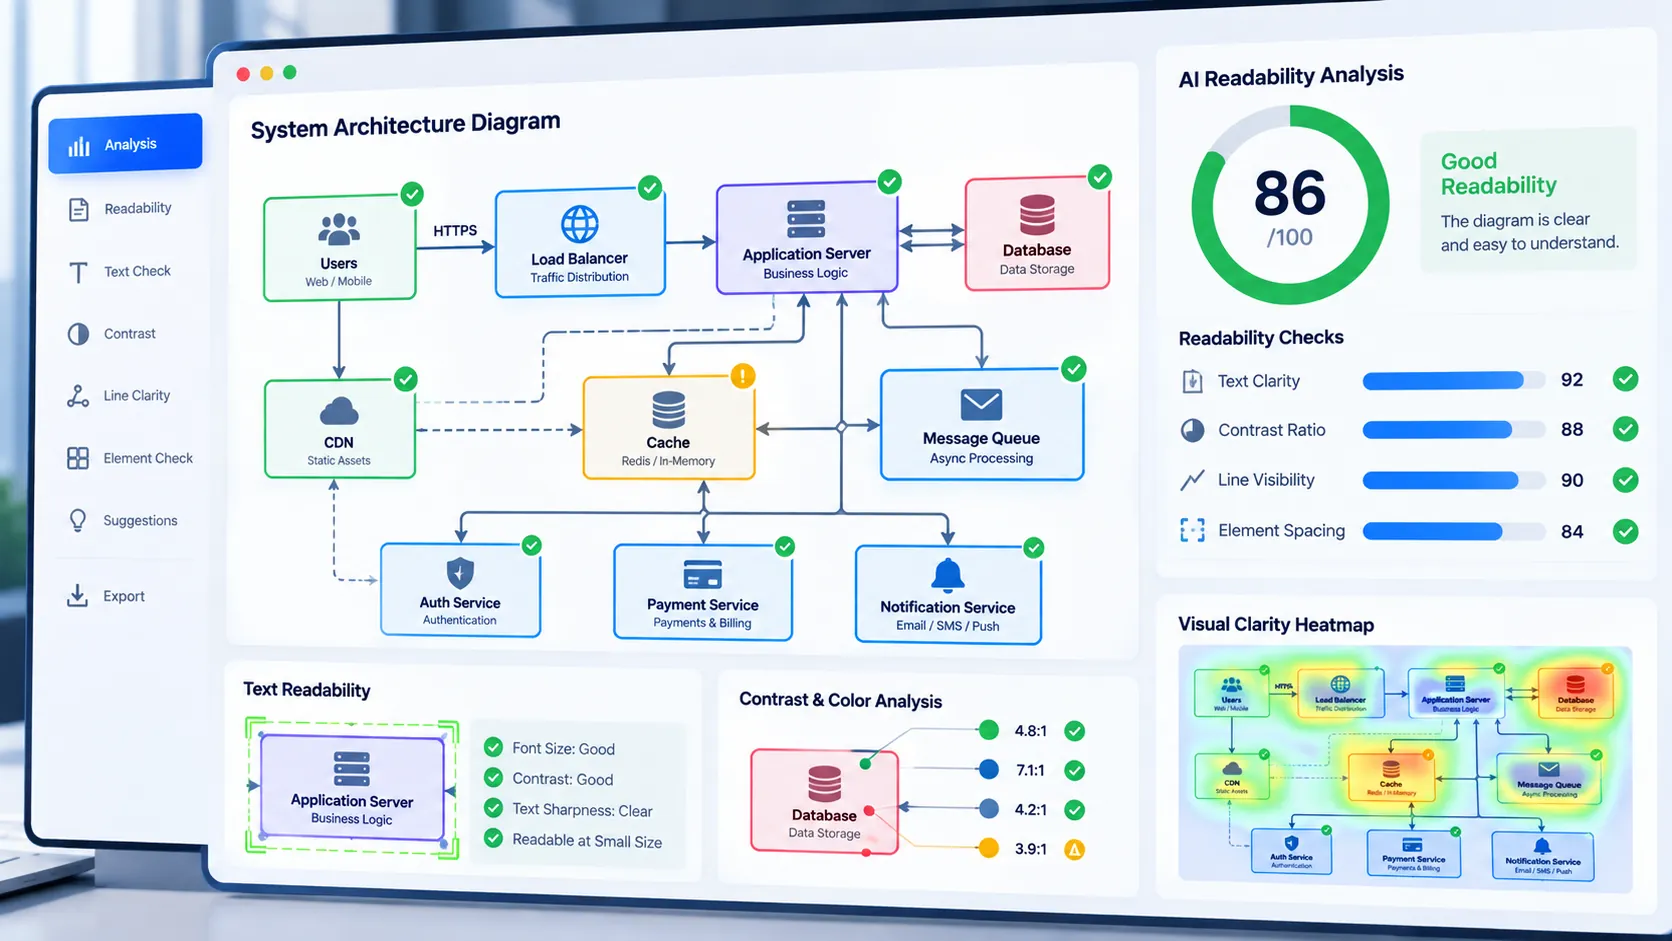
Image Diagram AI Readability Checker helps you evaluate whether a diagram image is visually prepared for AI vision systems and human review. It checks diagram text and fine-detail signals, connector and line visibility, text/background contrast, layout structure, visual clutter, and overall diagram scale directly in your browser without sending the image to a server.
Image Diagram AI Readability Checker
Check whether a diagram image has measurable visual conditions that support clear AI-oriented interpretation of text, lines, connectors, shapes, structure and visual detail.
Upload a diagram to check readability
AI-oriented diagram readability assessment
—
Diagram readability checks
How to Use the Image Diagram AI Readability Checker in Simple Steps
- Upload a diagram image. Drag and drop a JPG, PNG, WebP, GIF, BMP, or AVIF file into the tool, or use the file picker. Images up to 20 MB are supported.
- Click “Check Diagram Readability.” The tool analyzes the image locally in your browser using sampled visual and pixel-level signals. No API key or account is required.
- Review the readability score and checks. The report shows an overall score from 0 to 100 along with signals for diagram text and fine detail, lines and connectors, contrast, layout structure, visual clutter, and diagram scale.
- Export or reuse the result. Use Copy Report, Copy JSON, Download JSON, or Download PDF to keep the analysis. Use Load Example to test the tool with a generated architecture diagram, or Clear to start another analysis.
Technical Breakdown of the Image Diagram AI Readability Checker
The Image Diagram AI Readability Checker is a browser-side visual preflight tool. It does not send the uploaded image to a remote AI vision API and does not claim to understand the semantic meaning of individual diagram objects. Instead, it measures visual properties that can affect whether diagram information is easy to inspect, extract, or interpret.
Diagram text and fine-detail signal
Small labels, node names, annotations, legends, and other fine visual details need enough pixel information to remain distinguishable. The analyzer samples image detail and local luminance changes to estimate whether the diagram contains usable fine-detail information.
A weak signal can occur when a diagram has been heavily resized, compressed, blurred, or exported at a small resolution.
Line and connector signal
Flowcharts, architecture diagrams, process maps, network diagrams, and technical illustrations often depend on lines, arrows, borders, and connectors. The tool evaluates neighboring-pixel differences to estimate the presence and visibility of structural line information.
This is a visual signal rather than semantic arrow detection. A high score does not mean the tool has identified every connector correctly.
Text/background contrast signal
Diagram labels need separation from their surrounding backgrounds. The analyzer evaluates luminance differences and related local visual transitions to estimate whether text-like regions have sufficient contrast.
Complex backgrounds, gradients, shadows, thin light text, and low-contrast labels can reduce this signal.
Layout structure signal
Readable diagrams normally contain recognizable spatial organization rather than completely uniform or visually chaotic detail. The analyzer samples structural changes across the image to estimate whether useful layout variation is present.
The result should be treated as a visual baseline, not as a semantic understanding of the diagram’s hierarchy or relationships.
Visual clutter control
A diagram can contain plenty of detail while still being difficult to inspect because too many edges, labels, boxes, or visual transitions compete for attention. The analyzer uses image-level complexity signals to estimate whether the visual field is excessively cluttered.
High complexity is not automatically bad. A detailed engineering diagram can legitimately contain many elements, so this check should be interpreted together with the other signals.
Diagram scale
Image dimensions affect how much information is available for labels, connectors, and fine diagram elements. The tool considers the source dimensions and analyzes a scaled working representation so large images can be processed efficiently in the browser.
The analysis canvas is capped at approximately 1,800 pixels on the longest side. This keeps browser processing practical while preserving a useful representation of the source image.
Score interpretation
The tool combines its six visual checks into a 0–100 readability score:
- 80–100: Strong diagram readability baseline
- 60–79: Moderate diagram readability baseline
- 0–59: Limited diagram readability baseline
The score is a preflight signal, not a guarantee that a particular AI vision model will correctly read or understand the diagram. Different vision systems can respond differently to the same image.
Privacy and processing
Image analysis happens in the browser. The tool does not require an API key, account, or server-side image-processing workflow for the core analysis.
For privacy-sensitive diagrams, you should still review your browser environment and any external software you use before uploading confidential material.
Supported formats and limit
The analyzer accepts common raster image formats including JPG, PNG, WebP, GIF, BMP, and AVIF. The maximum supported upload size is 20 MB.
Animated or unusually encoded files may behave differently depending on browser support. The tool analyzes the browser-decoded visual representation rather than promising compatibility with every possible encoder variant.
How this differs from general image quality checking
General image-quality tools often focus on dimensions, sharpness, compression, or visual quality. This checker is specifically structured around diagram-oriented signals such as fine-detail visibility, connector/line structure, text contrast, spatial layout, clutter, and diagram scale.
For broader image preparation, use the AI Image Readiness Checker. For general AI vision extraction signals, use the AI Vision Extractability Checker.
Developer Snippets (Automate This Tool Offline)
The web tool performs its analysis locally and visually through browser-side image processing. The following snippets provide lightweight offline preflight checks for image dimensions and file characteristics. They are useful when you want to prepare diagram assets before putting them through the full browser analyzer.
Python
from PIL import Image
from pathlib import Path

image_path = Path("diagram.png")

with Image.open(image_path) as image:
    width, height = image.size
    megapixels = (width * height) / 1_000_000

    print(f"Format: {image.format}")
    print(f"Dimensions: {width} x {height}")
    print(f"Megapixels: {megapixels:.2f}")
    print(f"Aspect ratio: {width / height:.3f}")

    if width < 1200 or height < 800:
        print("Review: diagram dimensions may be limiting for small labels.")
    else:
        print("Review: dimensions provide a larger working area for diagram detail.")
PowerShell
$file = Get-Item ".\diagram.png"

Add-Type -AssemblyName System.Drawing

$image = [System.Drawing.Image]::FromFile($file.FullName)

$width = $image.Width
$height = $image.Height
$megapixels = ($width * $height) / 1000000

Write-Output "Dimensions: $width x $height"
Write-Output ("Megapixels: {0:N2}" -f $megapixels)
Write-Output ("Aspect ratio: {0:N3}" -f ($width / $height))

$image.Dispose()
Node.js
const fs = require("fs");

const filePath = "./diagram.png";
const stats = fs.statSync(filePath);

console.log(`File size: ${(stats.size / 1024 / 1024).toFixed(2)} MB`);

if (stats.size > 20 * 1024 * 1024) {
    console.log("Review: file is above the 20 MB limit used by the web tool.");
} else {
    console.log("Review: file size is within the web tool limit.");
}
These snippets do not reproduce the PKCapra readability score. They are offline preparation examples for checking basic file conditions before browser-based visual analysis.
Native Software Workaround: Improve a Diagram Before AI or OCR Processing
PowerPoint provides a practical workflow for improving a diagram before exporting it as an image.
- Open the diagram in PowerPoint and select the diagram or slide containing it.
- Increase the size of small labels, legends, and annotations where practical.
- Select text and use Home → Font Color to increase separation from the background.
- Select shapes and use Shape Format → Shape Fill and Shape Outline to reduce unnecessary visual competition.
- Review connectors under Shape Format → Shape Outline and increase their visibility when thin lines are difficult to distinguish.
- Remove decorative elements that do not communicate information.
- Keep important labels and connectors away from the extreme edges of the composition.
- Export the slide or diagram using File → Save As or File → Export, then choose a raster image format such as PNG.
- Upload the exported image to the Image Diagram AI Readability Checker and compare the resulting signals.
For screenshots containing interface text rather than diagrams, the Screenshot AI Extractability Checker is more specifically focused on screenshot-oriented signals.
Frequently Asked Questions
What does the Image Diagram AI Readability Checker measure?
The Image Diagram AI Readability Checker measures diagram text and fine-detail signal, line and connector signal, text/background contrast, layout structure, visual clutter, and diagram scale.
Does the tool use an AI vision model?
The tool does not use an external AI vision model for its core score. It uses browser-side image analysis and pixel-level visual signals to create a diagram readability baseline.
Does the tool understand what each diagram box means?
Semantic diagram understanding is not provided by the checker. The analysis measures visual characteristics such as detail, contrast, structural transitions, and layout rather than determining the meaning of individual nodes or relationships.
Can I analyze confidential diagrams?
Browser-side processing means the core image analysis does not require uploading the image to a remote AI vision service. Confidentiality can still depend on your browser, device, extensions, and any other software involved in your workflow.
What image formats are supported?
JPG, PNG, WebP, GIF, BMP, and AVIF are supported by the tool, subject to browser decoding support.
What is the maximum image size?
The maximum upload size is 20 MB. Very large images are processed through a scaled analysis representation with the longest side capped at approximately 1,800 pixels.
What does a low readability score mean?
A low score means the image shows weaker visual signals across one or more diagram-readability checks. Common contributors can include small dimensions, weak contrast, low fine-detail visibility, weak connector signals, excessive clutter, or limited diagram scale.
Does a high score guarantee that an AI will understand my diagram?
A high score does not guarantee semantic understanding by an AI system. It indicates stronger visual conditions according to the checks used by this analyzer, while different AI vision models can produce different results.
Can I improve a diagram after checking it?
Diagram improvements can include increasing label size, improving text/background contrast, making connectors more visible, reducing unnecessary visual clutter, and exporting the diagram at a larger raster size.
Can I export the analysis?
The tool provides Copy Report, Copy JSON, Download JSON, and Download PDF actions so the analysis can be saved or shared.