
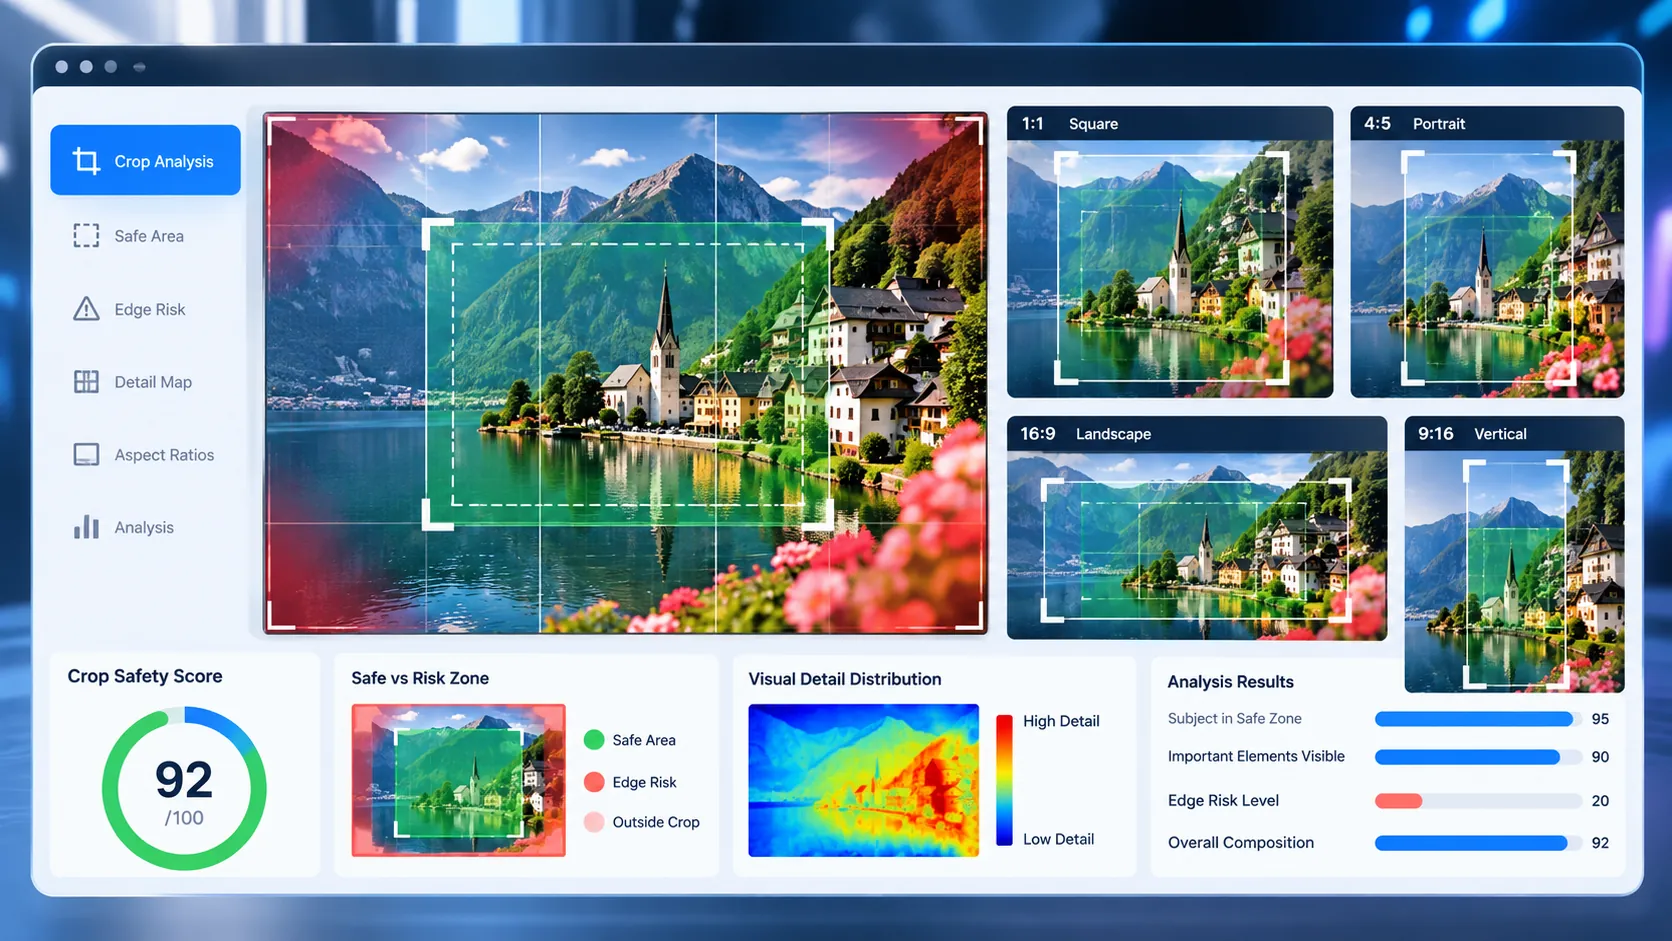
AI Vision Crop Safety Checker helps you check whether important-looking visual detail is likely to survive common image crops. It performs browser-side heuristic analysis of visual concentration, edge risk, central safe-area coverage, detail distribution, and common aspect-ratio adaptability. It does not use an AI vision model, identify objects or people, or understand the semantic importance of image content.
AI Vision Crop Safety Checker
Check whether important visual detail is likely to survive common image crops by analyzing visual concentration, edge risk, central safe area, detail distribution and aspect-ratio adaptability.
Upload an image to check crop safety
AI vision crop safety assessment
—
Common crop scenarios
Crop safety checks
How to Use the AI Vision Crop Safety Checker in Simple Steps
- Upload an image by dragging it into the tool or selecting a file from your device.
- Click Check Crop Safety to run the browser-side crop analysis.
- Review the overall crop safety score, visual focus, edge safety, center coverage, detail distribution, and common crop scenarios.
- Use Copy Report, Copy JSON, Download JSON, or Download PDF to save the analysis.
The tool accepts JPG, PNG, WebP, GIF, BMP, and AVIF images when your browser can decode them. The maximum supported file size is 20 MB.
The analysis runs locally in your browser. The image is decoded and sampled through a browser canvas rather than being sent to an external AI vision service.
Technical Breakdown: What the AI Vision Crop Safety Checker Measures
The AI Vision Crop Safety Checker evaluates measurable visual patterns that can indicate whether an image may be vulnerable when its dimensions or aspect ratio change. It uses sampled visual energy and centered crop windows rather than semantic object detection.
Central Safe-Area Coverage
The analyzer examines the central region of the image and compares its measured visual signal with the overall image signal.
A stronger central signal means more of the measured visual detail is located inside the central safe area. A lower result means more measurable detail appears outside that central region.
This is useful for images that may be displayed in layouts where the edges can be removed during responsive cropping.
Edge Vulnerability
The tool evaluates visual activity near the outer edges of the image.
Strong visual concentration near the edges can increase crop vulnerability because common crops may remove part of those regions.
The result is presented as an edge safety signal. It does not identify whether the edge contains a person, product, logo, text, or another specific subject.
Detail Distribution
The analyzer compares measured visual detail across major regions of the image.
A relatively even distribution produces a stronger detail-distribution result. Strong regional differences indicate that visual information is concentrated unevenly, which can make some crops more sensitive than others.
Common Aspect-Ratio Adaptability
The tool evaluates centered crop windows for four common aspect ratios:
- 1:1 square
- 4:5 portrait
- 16:9 landscape
- 9:16 vertical
For each scenario, the analyzer estimates how much of its measured visual signal remains inside the centered crop window.
The result is an image-level crop estimate rather than a semantic understanding of what should remain visible.
Visual Focus Signal
The visual focus signal combines the sampled image’s overall visual activity and fine-detail signal.
A stronger signal means the image contains clearer measurable visual structure for crop preflight. A lower signal means there is less measurable visual structure available for the heuristic analysis, which also lowers confidence in crop-safety interpretation.
Image Dimensions and Aspect Ratio
The result also reports the original image dimensions, megapixels, file format, file size, and aspect ratio.
These values help explain why the same image may behave differently when prepared for square, portrait, landscape, or vertical placements.
Browser-Side Sampling Method
The analyzer first decodes the image and draws it to a browser canvas. Images are reduced to a maximum analysis dimension of approximately 1,800 pixels on the longest side.
The browser then samples luminance and neighboring-pixel differences to create a visual-energy grid. Regional averages from this grid are used to estimate central coverage, edge activity, detail distribution, and centered crop retention.
The common crop scenarios use centered crop windows. They do not simulate every possible manual crop position.
Understanding the 0–100 Score
The tool produces an overall crop safety score from 0 to 100.
A score of 80 or higher is presented as a Low crop-risk baseline.
A score from 60 to 79 is presented as a Moderate crop-risk baseline.
A score below 60 is presented as a Higher crop-risk baseline.
The score combines five browser-side checks:
- Central safe-area coverage
- Edge vulnerability
- Detail distribution
- Common aspect-ratio adaptability
- Visual focus signal
The score is a heuristic image-level measurement. It does not guarantee that a particular social platform, website theme, CMS, ad system, or AI vision system will preserve a specific subject after cropping.
Reading the Common Crop Scenarios
Each crop scenario displays a score and an estimated visual-signal retention percentage.
Safer means the calculated crop score is at least 80.
Review means the calculated crop score is between 60 and 79.
Higher crop risk means the calculated crop score is below 60.
These labels describe the measured visual signal retained by the centered crop window. They do not mean that the crop is guaranteed to preserve the most important semantic element in the image.
For broader image preparation checks, use the AI Image Readiness Checker. For visual extraction signals, compare the image with the AI Vision Extractability Checker. For text-specific image analysis, the Image Text Legibility Analyzer focuses on resolution, contrast, character-scale detail, sharpness, background consistency, and related signals.
Developer Snippets (Automate This Tool Offline)
The following examples provide basic offline crop-preflight building blocks. They can help developers inspect image dimensions and simulate centered crop windows before using a more complete image-analysis workflow.
Python
from PIL import Image

path = "image.jpg"
image = Image.open(path)

width, height = image.size
image_ratio = width / height

targets = {
    "1:1": 1.0,
    "4:5": 4 / 5,
    "16:9": 16 / 9,
    "9:16": 9 / 16,
}

for label, target_ratio in targets.items():
    if image_ratio > target_ratio:
        crop_width = round(height * target_ratio)
        left = (width - crop_width) // 2
        box = (left, 0, left + crop_width, height)
    else:
        crop_height = round(width / target_ratio)
        top = (height - crop_height) // 2
        box = (0, top, width, top + crop_height)

    cropped = image.crop(box)
    cropped.save("crop-" + label.replace(":", "-") + ".jpg")

    print(label, ":", cropped.size)
This example creates centered crops for the same aspect ratios used by the browser tool. It does not reproduce PKCapra’s visual-energy scoring.
PowerShell
$Path = "image.jpg"

Add-Type -AssemblyName System.Drawing

$Image = [System.Drawing.Image]::FromFile($Path)

$Width = $Image.Width
$Height = $Image.Height
$AspectRatio = $Width / $Height

Write-Output "Dimensions: $Width x $Height"
Write-Output ("Aspect ratio: {0:N3}" -f $AspectRatio)
Write-Output ("Megapixels: {0:N2}" -f (($Width * $Height) / 1000000))

$Image.Dispose()
This provides a simple offline image-dimension preflight. A full crop-safety implementation would additionally sample pixels and evaluate the regions retained by each crop window.
Node.js
const fs = require("fs");

const file = "image.jpg";
const maxBytes = 20 * 1024 * 1024;

const stats = fs.statSync(file);

if (stats.size > maxBytes) {
  throw new Error("Image exceeds the 20 MB preflight limit.");
}

console.log("File:", file);
console.log("Size MB:", (stats.size / 1024 / 1024).toFixed(2));

// Use a local image library such as sharp when
// dimensions, resizing, cropping, and pixel sampling are required.
These snippets are basic offline building blocks. They do not call PKCapra, an external AI API, or a remote image-processing service.
Native Software Workaround: Test Common Crops in Microsoft PowerPoint
Microsoft PowerPoint can be used to manually test whether an image remains useful after common aspect-ratio crops.
Open PowerPoint and insert the image with Insert → Pictures.
Select the image and use Picture Format → Crop → Aspect Ratio.
Test the available aspect-ratio options that match your intended publishing layout. For example, use a square crop when preparing a square placement and a wide crop when preparing a landscape placement.
Move the crop window while checking whether important-looking visual detail approaches the edges or disappears from the frame.
Repeat the test at the approximate display size where the image will actually be used.
This manual workflow is useful when semantic judgment matters because a human can identify whether a specific product, headline, logo, chart, or other important element remains visible.
For a measurable browser-side preflight across common centered crop shapes, save the image and run it through the AI Vision Crop Safety Checker.
Frequently Asked Questions
What is the AI Vision Crop Safety Checker?
The AI Vision Crop Safety Checker is a browser-side heuristic tool that estimates image crop vulnerability using visual concentration, edge activity, central safe-area coverage, detail distribution, visual focus, and common aspect-ratio crop retention.
Does the tool use an AI vision model?
The tool does not use an AI vision model. It uses browser-side image sampling and heuristic calculations based on measurable visual patterns.
Does the tool detect faces, people, products, or objects?
The tool does not identify faces, people, products, objects, or other semantic elements. It measures visual signals without understanding what those regions represent.
Which crop ratios does the tool check?
The tool checks centered crop windows for 1:1 square, 4:5 portrait, 16:9 landscape, and 9:16 vertical layouts.
What does the crop safety score represent?
The score represents a 0–100 image-level crop-risk baseline derived from central coverage, edge vulnerability, detail distribution, common crop adaptability, and visual focus signals.
Does a high score guarantee that an important subject will survive a crop?
A high score does not guarantee semantic preservation. The analyzer does not know which object, person, text, or region is most important in the image.
What is the maximum image size?
The maximum supported file size is 20 MB. Very large images are reduced to an analysis canvas with a maximum dimension of approximately 1,800 pixels on the longest side.
Which image formats are supported?
The supported formats are JPG, PNG, WebP, GIF, BMP, and AVIF when the browser can decode them.
Does the image get uploaded to a server?
The image analysis runs locally in the browser. The tool does not require an external AI vision service or API key for its crop-safety analysis.
Can I save the crop-safety report?
The tool provides Copy Report, Copy JSON, Download JSON, and Download PDF actions for saving or sharing the analysis.
What should I do if a common crop shows higher risk?
A higher-risk crop indicates that the centered crop removes a larger share of the measured visual signal. Review the individual crop scenario, then consider repositioning the subject, increasing safe margins, changing the original composition, or creating a dedicated crop for that aspect ratio.